|
|
|
|
|
This is a timeline
that accounts the incredible growth of the anchovy industry from the early
1900s to its collapse in the 1970s, and then examines the struggle to
recover. Use it to help orient yourself to the case.
|
 |
 |
|
- 1910s.
Guano Administration Company lobbied against expansion of
the fishing industry.
- 1920s.
Proposals for industrialized development of fishing in Peru
unsuccessful.
- 1930s.
First successful cannery established.
- Canned
fish was the main product with fishmeal and fish oil
produced as by-products from cannery residues.
- State-owned
Compania Administradora de Guano become interested in
fishmeal as possible supplement to inadequate supplies
of guano.
(Thorp,
1978) |
 |
|
- World
War II. U.S. market cut off from main suppliers of fish
products (Japan and Scandinavia)
- Canned
fish and fish-liver oil were main sources of Vitamins
A & D for U.S. troops.
- 1942.
First fish-liver canning enterprise financed from commercial
banking sector
- 1945.
Fish products comprised 1% of exports.
- There
were 23 canneries in operation along the coast, of which
six were plants of considerable size.
- 1946.
Wilbur Ellis Company (major U.S. fish products dealer) earns
substantial profits from productions of fish liver and smoked
and salted fish for the European recovery program
(Thorp,
1978) |
|
Table
8.3 Percentage shares of major exports by value,
1930 to 1950 (based on values at current prices)
|
|
Percentage
shares of total export earnings
|
|
|
|
Wool
& coffee
|
Fish
products
|
Copper
& silver
|
Lead
& zinc
|
Oil
|
|
1930
|
28.5
|
3.3
|
-
|
20.1
|
6.8
|
29.7
|
|
1935
|
34.4
|
3.0
|
-
|
17.7
|
2.2
|
37.8
|
|
1940
|
28.2
|
5.2
|
-
|
22.3
|
3.1
|
24.8
|
|
1945
|
52.9
|
3.3
|
0.9
|
9.6
|
7.4
|
12.5
|
|
1950
|
50.5
|
4.6
|
2.9
|
9.4
|
11.7
|
13.1
|
|
This
compares the values of the major exports from
Peru between 1930 to 1950. Cotton and sugar clearly
dominate, and fish products trail far behind.
|
|
|
|
|
| back
to top |
 |
- Peruvian
entrepeneurs lobbied for government support of the fishing
industry.
- Private
firms begin to specialize in processing fishmeal
with anchovy. Over 90% of the 49 plants controlled by middleclass
entrepeneurs of Peruvian and immigrant origin.
- Improved
fishing technology and increased demand for livestock feed
propel fishmeal as a valuable global commodity.
- Peruvian
fishing fleet became equipped with sonar equipment to
locate fish shoals.
- Lightweight
nylon nets introduced to fishing industry to replace
less efficient cotton nets.
- Anchovy
accounted for about half of the world's fishmeal production.
- Collapse
of sardine industry in California bring good quality and
modern efficiency to Peruvian fishers at cheap, second hand
prices.
- Peruvian
commercial banks were willing to finance new fishmeal enterprises
by means of short-term loans, renewed annually.
(Thorp,
1978) |
|
|
| back
to top |
|

Peru
has become world's leading fishing nation in terms of volume
- Fishmeal
processing plants peak at 154 plants.
- 1964.
Peru harvested 18% of total world fish catch, and produced
~40% of total world supply of fishmeal.
- Fish
products account for 25 to 30% of total export earnings,
and becomes leading export sector.
- Anchovy
account for 99% of fishmeal production.
- mid
60s. Signs of overfishing in north and central coasts.
Fishing fleets begin to explore untapped fishing grounds
of the south coast.
- Fishing
companies struggle to remain competitive by increasing
investment in new, larger fishing boats. Firms fight
to meet quotas before their competitors do. Industry
now able to process 16 million tons of anchovy annually.
- 1968.
Annual anchovy catch soared above 10 million tons, meanwhile
the Guano bird
population plumeted from over 15 million in the early 1960s
to under 5 million.
(Thorp,
1978)
|
|
Table
12.5 Growth of Peruvian fish catch & production
of fishmeal & canned fish (1000 metric tons,
annual avg)
|
|
|
Peruvian
catch of
|
Peruvian
production
|
|
|
all
fish varieties
|
anchovy
|
canned
fish
|
fish
meal
|
|
1940-4
|
19
|
-
|
n.a.
|
<1
|
|
1945-9
|
53
|
-
|
6
|
<1
|
|
1950-4
|
153
|
21
|
13
|
10
|
|
1955-9
|
1,027
|
638
|
21
|
117
|
|
1960-4
|
6,551
|
6,103
|
18
|
1,046
|
|
1965-9
|
9,215
|
8,964
|
9
|
1,622
|
|
1970-1
|
11,610
|
11,272
|
11
|
2,095
|
|
1972-3
|
3,534
|
3,108
|
12
|
663
|
|
1974
|
|
3,644
|
|
841
|
| This
compares fish catch with fish production. Anchovy
comprised more than half the fish catch by 1955-59.
During that same time interval, fish meal production
also increased dramatically. Notice the huge drop
in anchovy catch and fish meal production in 1972-3. |
|
|
|
Table
12.6 Value of fish-product exports, 1940-74 (million
dollars, annual avg)
|
|
|
Canned
fish
|
Fish
meal
|
Fish
oil
|
Other
|
Total
|
|
1940-4
|
0.2
|
-
|
-
|
0.1
|
0.3
|
|
1945-9
|
2.0
|
0.1
|
-
|
0.8
|
2.9
|
|
1950-4
|
5.3
|
0.8
|
0.2
|
1.5
|
7.8
|
|
1955-9
|
7.6
|
11.3
|
1.5
|
2.2
|
22.6
|
|
1960-4
|
6.3
|
87.5
|
10.9
|
2.0
|
106.7
|
|
1965-9
|
3.4
|
13.2
|
19.4
|
2.3
|
208.3
|
|
1970-3
|
4.8
|
188.7
|
32.5
|
4.6
|
222.1
|
|
Comparing
the value of the Peruvian fish-product exports.
Fish meal became a much more valuable commodity
compared to the other products by 1960.
|
|
|
|
|
| back
to top |
 |
|
- Industry
possessed capacity for a 30 million ton annual catch.
- 1970.
FAO (Food and Agriculture Organization of United Nations)
warned that maximum sustainable yield for anchovies could
not exceed 9.5 million tons annually.
- Anchovy
catch rose above 12 million tons in 1970, and 10 million
in 1971.
- Annual
catch of anchovies plunged to 4 million in 1972 and 1.3
million in 1973.
- The
Peruvian Anchovy Industry no longer economically viable.
What
makes the industry "economically viable" in the
first place? This will be important to consider for your company's
investment concerns.
(Glantz,
2001; Thorp, 1978)
|
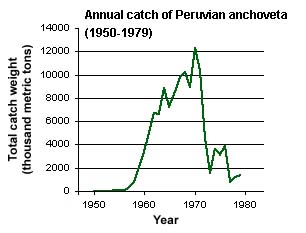
source:
Data for figure from FAO Fish Stat 2001.
|
|
|
| back
to top |
 |
|
- The
anchovy population has been struggling to recover for 30
years, since the early 1970s.
- Anchovy
catch dropped further from 1982 to 1985 with an all time
low of only 22,000 metric tons in 1984.
- Recovery
finally looked promising during the early 90s as evidenced
by increased anchovy catch, but catch plummeted again in
1998.
- What
happened around 1982 that could have led to incredible drop
in 1984?
- What
about the 1998 drop? But that also seemed to show a fairly
quick recovery.
- Could
the causes be related to each other as well as the initial
decline in 1972?
(Glantz,
2001; Thorp, 1978)
|
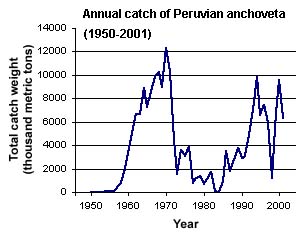
source:
Data for figure from FAO Fish Stat 2001.
|
|
|
| back
to top |
|
| |
|
This web
site was created by Lynn Tran at the North Carolina State University, Department
of Mathematics, Science, and Technology Education on 7/12/03. Faculty advisor
Dr. David Eggleston, NCSU, Department of Marine, Earth, & Atmospheric Sciences.
Last updated
December 29, 2003
.
|