|
Brown, pink, and white shrimp constitute the primary commercial shrimp catches, and they are predominantly harvested by trawls in the Pamlico Sound.
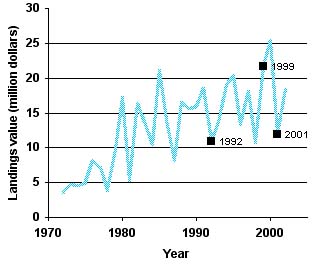
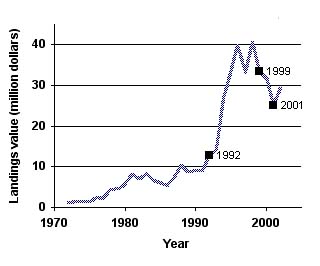
Shrimp is ranked as the second most valuable seafood in NC. Figure 1a shows the fluctuating value of shrimp landings from the early 1970s until present. Nonetheless, there is an overall increase in dollars generated from shrimp landings during these three decades. The data combine landing values for brown, pink, and white shrimp.
(www.ncfisheries.net/bluecrab/index.html)
|
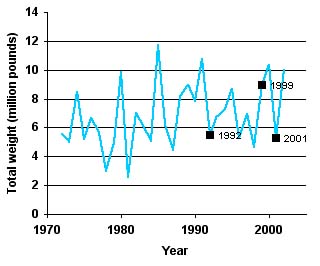
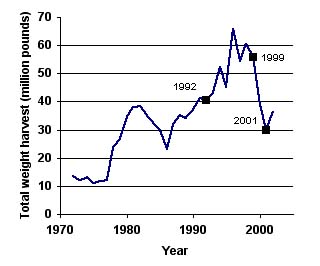
This is s a graph of the shrimps landed in North Carolina by weight over a period of three decades, which correspond with the landings value in Figure 1a. Notice the fluctuation in shrimps caught. Unlike the landing values, there does not appear to be an overall increase in shrimp caught.
- What do you think the lack of overall increase in shrimp caught suggest about the shrimp population in North Carolina?
- Notice the decline in shrimp catch from 1999 to 2001. Could there be a connection between this and the blue crab decline?
- How can increased shrimp harvesting affect blue crab population? Think about the shrimp harvesting method and location in NC.
|
Striped bass is a prized commercial and recreational fish. Its popularity almost led to its demise throughout the Atlantic coast in the 1970s and 80s. The Albemarle-Roanoke stock has been declared recovered since 1997, and since then recreational fishermen account for ~75% of total landings.
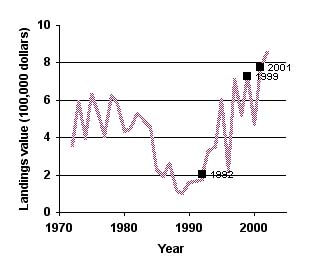
Figure 2a shows the tumultuous economic value of the striped bass in North Carolina. Striped bass landings value reached an all time low from the mid 1980s to early 1990s, but appears to be recovering in the last five years.
- Is analysis of the landings value a good indication of the population status of a target species?
- What does the landings value communicate about the target species?
(www.ncfisheries.net/bluecrab/index.html)
|
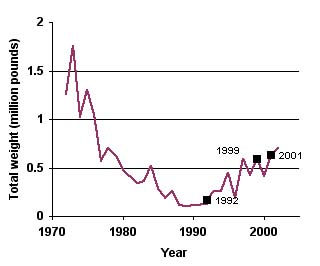
This chart displays the total weight of striped bass caught between 1972 to 2002. Despite fluctuations in catch, there has been a continuous decline in striped bass caught. However, there appears to be a steady increase in landings since the late 1990s.
- What does the decline in catch suggest about the striped bass population in North Carolina?
- Can the slight increase in total landings by weight since the late 1990s imply that the striped bass population is recovering and will be maintained?
![]()
|
Blue crabs are common to all North Carolina coastal waters, but are most abundant in the Albemarle and Pamlico Sounds. It is within these sounds that most blue crabs are harvested by both commercial and recreational fishermen.
In North Carolina, the blue crab is the most valuable commercial fishery. Figure 3a shows the steady growth of the blue crab's economic value from the early 1970s. Notice the skyrocketed value during the early 1990s. In 1996, over 65.5 million pounds of blue crabs were harvested commercially with an estimated value of $40 million.
(www.ncfisheries.net/bluecrab/index.html; www.blue-crab.org; www.ncfish.org)
|
|
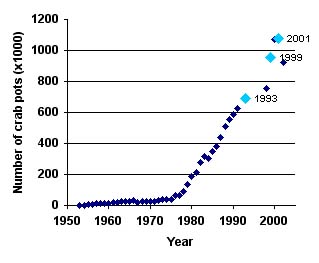
Notice the steady increase in blue crab catch until the sudden drop in 1999-2001. Compare this with the steady increase in number of pots used from the mid 1970s to 2003, with a dramatic rise in 1999-2001.
The continued increase in pots used and crabs caught over the past 10 years suggest a decrease in CPUE. The sudden drop in catch in 1999 despite dramatic rise in crab pots used allude to a noticeable decline in blue crab population in North Carolina.
- Is it possible for North Carolina fishermen to be overfishing the blue crab population?
- How can this have happened if catch and effort have been increased together for three decades?
The number of pots used to catch blue crabs indicate the amount of effort put forth by fishermen to harvest the crabs. The catch is represented by the total weight of the blue crabs harvested. Catch per unit effort is a calculation used by fisheries biologists and managers to track the population status of a fishery.
increase CPUE = fishery is catching more per unit of effort, or less effort is needed to catch the same amount or more of the target species. Thus population of target species is potentially growing or remaining steady.
decrease CPUE = fishery is catching less per unit of effort, or more effort is put forth to catch the same amount or more of the target species. Thus population of target species is potentially declining.
This web site was created by Lynn Tran at the North Carolina State University, Department of Mathematics, Science, and Technology Education on 7/12/03. Faculty advisor Dr. David Eggleston, NCSU, Department of Marine, Earth, & Atmospheric Sciences. Last updated December 29, 2003 .