In 2002, fish and shellfish harvest in Alaskan waters totaled 5.0 billion pounds with an estimated value of $955 million. Salmon ($141 million), groundfish ($553 million), herring ($10 million), halibut ($121 million), and shellfish ($130 million) are the dominant industries. Despite annual fluctuations in value of the Alaskan harvests, there has been a steady decline since the 1988 peak of $2.5 billion.
(2003 Overview Division of Commercial Fisheries, Alaska Department of Fish and Game)
SEA URCHIN
Figure 1. Sea urchin landings by weight from Alaskan coast from 1980 to 1994. Sea urchins were first harvested commercially in Alaska in 1980, and landings peaked in 1987 at 757,000 pounds. However, it is still in the developmental stages as a viable industry. SCUBA divers harvest the sea urchins in three principle areas (Ketchikan in the southeast, Kodiak Island in the western gulf, and Homer in the Cook Inlet). Red sea urchins have been harvested near Ketchikan, and mostly green sea urchins have been harvested in Kodiak and Homer. Harvesting permits with specified harvest areas, time, and size limits are required. Success of the sea urchins may ultimately depend on the sea otter population.
source: seaurchin.org/Sea-Grant-Urchins.html#t1
- How do sea urchin fishers benefit from a decline in sea otter population?
- How likely are they responsible for reducing the sea otter population?
- Could humans be outcompeting sea otters for sea urchins?
- Question 1 suggests that sea otters are starving. What evidence is necessary to indicate that humans are outcompeting sea otters for urchins?

The dominant commercial fish species include herring, salmon, and groundfish (flounder, sole, arrowtooth).
- How are the marine organisms in this ecosystem responding to increased and improved human harvest of these fish?
- What evidence would indicate a potential impact on these marine organisms?
|
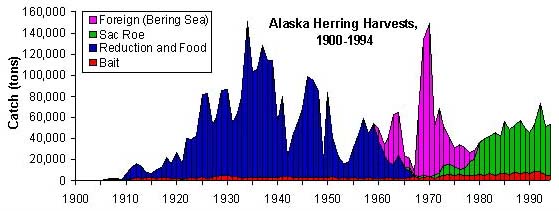
Herring was no longer targeted for reduction into fish meal by the 1960s. Since then there has been an increased interest in herring roe (i.e. eggs), a sushi delicacy. Almost all herring roe are exported to Japan. |
|
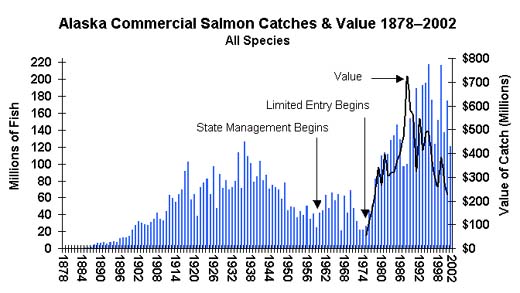
Catch of Alaskan salmon has fluctuated. The drop in value of Alaskan salmon is primarily due to the increased availability of farmed salmon. (2003 Overview Division of Commercial Fisheries, Alaska Department of Fish and Game) |
Alaska has the most federal land than any other state in the Union, and is rich in biological, mineral, and enrgy resources. It is the second highest oil-producing state. According to the 1995 USGS National Oil and Gas Assessment, Alaska has the greatest amount of undiscovered oil and natural gas resources in the country. There are large reserves of coal, natural gas hydrates, and conventional natural gas.
NPRA is the National Petroleum Reserve-Alaska, and is the focal point of petroleum explorations in Alaska. The Exxon-Valdez oil spill in 1989 took place in Prince William Sound on the south coast of Alaska.
(energy.usgs.gov/alaskaoverview.html)
- Can petroleum exploration impact the sea otter population?
- If so, how?
|

This web site was created by Lynn Tran at the North Carolina State University, Department of Mathematics, Science, and Technology Education on 7/12/03. Faculty advisor Dr. David Eggleston, NCSU, Department of Marine, Earth, & Atmospheric Sciences. Last updated December 29, 2003 .