|
| back
to data |
|
|
|
|
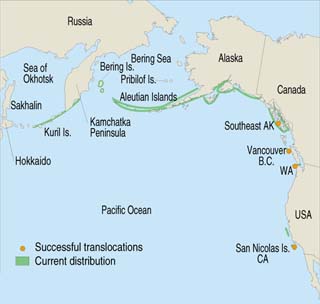
Sea otters
are found from the Gulf of Alaska around the Pacific Rim to northern Japan
with translocated pockets in southern California, Washington, Vancouver,
and southeast Alaska (Figure 1b). It is estimated that 90% of world's
population is found in coastal waters of Alaska.
(biology.usgs.gov/s+t/noframe/s043.htm)
|
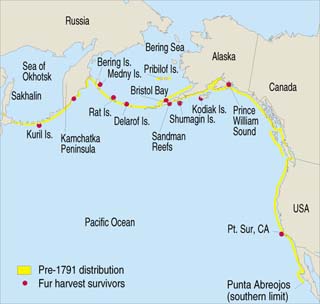 |
| Figure
1a. Distribution of sea otters before fur harvest began in 1741
and populations that survived the harvest, providing the nucleus
for recovery of the species. |
|
|
 |
|
Figure
1b. Current distribution of sea otters including locations
of successful translocations. Surving otters were used to
initiate translocated populations.
|
|
|
|
|
|
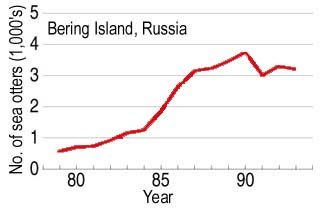
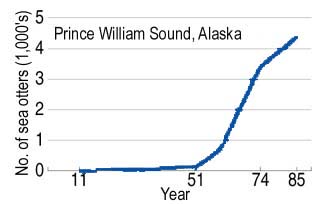
Graphs in Figure
2 show growth patterns observed in three sea otter population stocks in
the north Pacific resulting from natural range expansion.
- Bering Island
was recolonized by growing populations around Medny Island in 1970.
- Sea otters
in Prince William Sound were from the original surviving 1911 population.
- In 1969
& 1970, 59 sea otters were released along the outer coast of Washington
state. This represents a translocated population.
source:
J. L. Bodkin, R. J. Jameson, J. A. Estes (http://biology.usgs.gov/s+t/noframe/s043.htm)
|
 |
 |
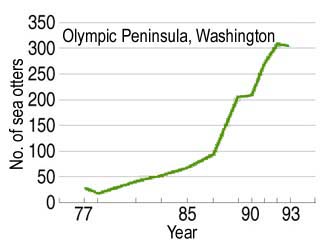 |
Figure
2. Population growth of sea otters in the Bering Sea, Prince
William Sound, and Olympic Peninsula. |
|
|
|
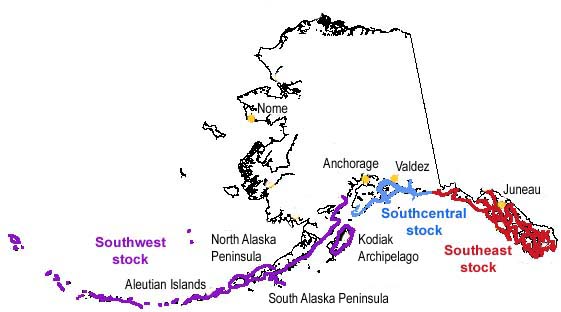
In March 1998,
US FWS officially divided the Alaskan sea otters into three stocks based
on differences in genetics, morphology, and geographic distribution. Figure
3 shows the general location of the three stocks. Recent aerial surveys
suggest:
- translocated
Southeast stock continues to grow
in numbers and expand in range,
- Southcentral
stock
(including Prince William Sound) is either stable or increasing,
- SOUTHWEST
STOCK has declined dramatically in the past 10-15 years
(U.S.
Fish & Wildlife Service, Marine Mammals Management Office, October
2001)
It
is estimated that 90% of the world population of sea otters reside in
the nearshore waters in Alaska. Since the 1911 international fur trade
ban, sea otters have shown healthy recovery. Population growth rates into
unoccupied habitat have been 17-20% per year.
This suggests that something unique is negatively
impacting the Southwest stock since the other stocks continue to prosper.
|
| Table
1. Southwest Alaska sea otter survey results, 1986-2001. |
| Location |
Year |
Count
or Estimate |
Decline |
| Aleutian
Islands |
1992
|
8,044
|
|
|
2000
|
2,442
|
70%
|
| North
Alaska Peninsula |
1986
|
9,061-13,091
|
|
|
2000
|
5,756
|
36-56%
|
|
South
Alaska Peninsula
|
1986
|
15,346-17,835
|
|
|
2001
|
1,344
|
91-92%
|
| Kodiak
Archipelago |
1989
|
13,526
|
|
|
1994
|
9,817
|
|
|
2001
|
5,892
|
56%
|
|
|
|
Table 1 estimates
the percent of population decline between the years indicated for each
location.
-
Could the geographic location of the Southwest stock contribute to the
decline?
|
|
|
|
Figure
3. Map of Alaska indicating general locations of three genetically
distinct sea otter stocks.
|
|
|
|
|
| Table
2 summarizes data from different studies that investigated potential physiological
and behavioral causes for the sea otter decline. The results suggest that
there has not been a reduction in reproduction or a redistribution of sea
otter populations. Exploring the possibilities for increased mortality show
evidence against disease, toxins, and starvation. However, one study provides
strong evidence for increased sea otter predation as a potential cause for
population decline. |
| Table
2. Conclusions from investigations regarding physiological and
behavioral causes for declining sea otter populations |
| Variable
|
Results |
| Reduced
fertility |
Birth
rates of radio-tagged adult females and pup survival at Amchitka
Island (1992-94) and Adak Island (1995-96) were similar to those
of stable populations. |
| Redistribution |
There
has been no population build up on any one island to account
for losses on others. Radio-tagged otters on Amchitka and Adak
show maximum distances moved were 4.31 and 6.95 km, respectively.
Marked animals that were lost disappeared suddenly and without
a trace. |
|
Increased
mortality
|
Population
declines with no reduction in birth rate or evidence of redistribution
suggest increased mortality. Mortality could be caused by disease,
toxins, predation, and starvation. |
|
(Estes
et al, 1998)
|
| Disease |
Few
beach-cast carcasses have been found. Blood analysis of
select otters on Adak, Amchitka, Kiska, and Kanaga Islands
show no signs of diseases. |
| Toxins |
There
have been reports of elevated contaminants in the Aleutian
Island, but they are restricted to a few small areas. |
| Predation |
Although
not a regular part of their diet, there have been at least
10 observed attacks on sea otters by killer whales. Population
comparisons of two sites, Clam Lagoon, Adak Island (inaccessible
to killer whales) and Kuluk Bay (open coastal environment),
from 1993 to 1997 show 76% decline at Kuluk Bay and stable
population at Clam Lagoon. Calculating caloric needs of
killer whale with decline in sea otter population in this
6-year period suggest only 5.05 attacks are needed. Six
of the ten killer whale attacks were observed during this
time period. |
| Starvation |
There
have been increases
in sea urchin biomass during sea otter decline. There
has also been striking changes in the kelp forest ecosystem
accompanying sea otter decline. |
|
|
|
| back
to data |
|
| |
|
This web
site was created by Lynn Tran at the North Carolina State University, Department
of Mathematics, Science, and Technology Education on 7/12/03. Faculty advisor
Dr. David Eggleston, NCSU, Department of Marine, Earth, & Atmospheric Sciences.
Last updated
December 29, 2003
.
|