The high oil content in anchovies made them less palatable, but ideal for other products such as fish oil and fish meal. Both products are valuable commodities worldwide. Fish oil was initially used for leather tanning, soap and glycerol production, and other non-food products. The residue from the fish oil was used as fertilizer.
After the turn of the century, farmers realized that dried, ground up fish was a good protein supplement for livestock. Since then, fish meal has been the preferable protein supplement for poultry, pigs, and fish. Today, the Food and Agriculature Organization of the United Nations (FAO) estimates that one third of the world's 75 millions tons annual fish catch is reduced to fish meal and oil.
VALUE
FISH MEAL is a protein-rich supplement for pig and poultry. It enhances their diet with essential amino acids, vitamins and minerals, and also promotes growth in young fowl and pigs. The growth factor reduces the time and costs involved in growing the chickens and pigs.
FISH OIL is directly consumed by humans as a supplement to reduce the risk of heart disease or death from heart disease.
(Roemer, 1970; FAO, 1986; www.oilofpisces.com/fishoilnutrient.html)
PERUVIAN MANAGEMENT
- Maintained an open access fishery (i.e. all fishers have equal access to same fish stock) until 1968.
- There was
no single office responsible for coordinating fishing policy.
- Ministry of Finance, Ministry of Agriculture, IMARPE, Ministry of Navy, Ministry of Labor, and Congress all had responsibility for specific decisions affecting fishing sector.
- 1963. IMARPE (Instituto del Mar del Perú) established. This is a semi-independent research institute with mainly a scientific advisory role.
- 1965. Restriction of fishing to 5 days per week.
- 1966. Declare
three-month veda (i.e. closed season) and indicated total annual
catch would be restricted below eight million tons in order to maintain
maximum sustainable yield.
- Close season during January to March, when small fish are abundant.
- Government unwilling to impose firm-by-firm quotas, which would place a maximum allowable catch per fishing company.
- A second closed season later in the year, starting when allowable catch is reached.
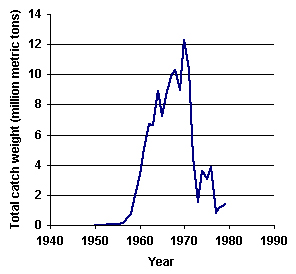
- Anchovy capture quota set at 9.5 million metric tons. Harvest in excess of this quantity would deplete available stock for following year.
- Compare the management effectiveness of the total annual catch restriction and the firm-by-firm fishing quota proposal. Which regulation do you think would have been most effective, and why?
- Was the anchovy harvesting quota ever exceeded?
- What kind of impact on the anchovy population would you expect if fishing quotas were ignored or not enforced?
- How effective was Peru's fisheries management?
|
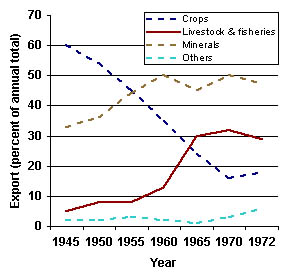
This figure compares the major Peruvian exports between 1945 to 1972. Peru exported crops such as sugar and cotton; mineral exports were primarily copper, zinc, and lead; and fisheries & livestock included fish meal and fish oil.
Notice the rapid increase of livestock & fisheries exports. Meanwhile, there was a rapid decline of crop export.
(Data for figure from Table 11.2 in Thorp, 1978)
Up until the early 1950s, Peru contributed a small percentage to the total world export of fish meal (Fig. 2). However, Peru's fish meal export skyrocketed in the 1950s. At its peak in 1964, Peru was responsible for 60% of the world's fish meal market.
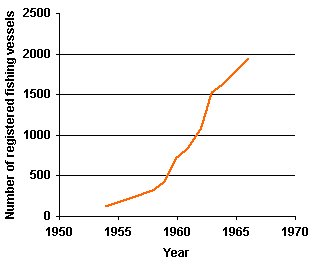
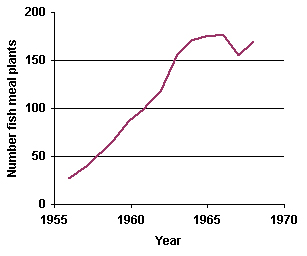
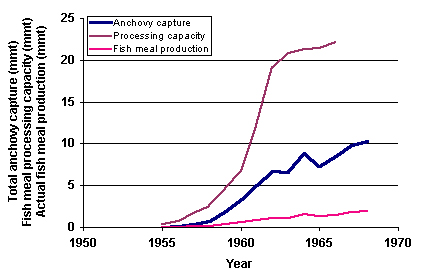
This rapid increase in fish meal production brought in millions of dollars into the Peruvian economy. Increased production was made possible by escalated investments in fishing fleet (Fig. 3) and fish processing plants (Fig. 4), which further increased fish capture (Fig. 5) despite government quotas.
- How do you think this exponential increase in fishing and processing capabilities influenced the overall anchovy population?
|
|
|
|
|
This figure compiles three sets of data for comparison:
Notice the fish meal processing capacity far exceeded fish meal production and anchovy capture. One of the problems Peru faced by the early to mid 1960s was an overabundance of fish processing plants.
|
|||
This web site was created by Lynn Tran at the North Carolina State University, Department of Mathematics, Science, and Technology Education on 7/12/03. Faculty advisor Dr. David Eggleston, NCSU, Department of Marine, Earth, & Atmospheric Sciences. Last updated December 29, 2003 .
